Pediatrics
Baby Weight Percentile Chart (WHO) — Is My Baby Normal?
Understand if your child's weight is appropriate for their age and how to spot growth issues early.
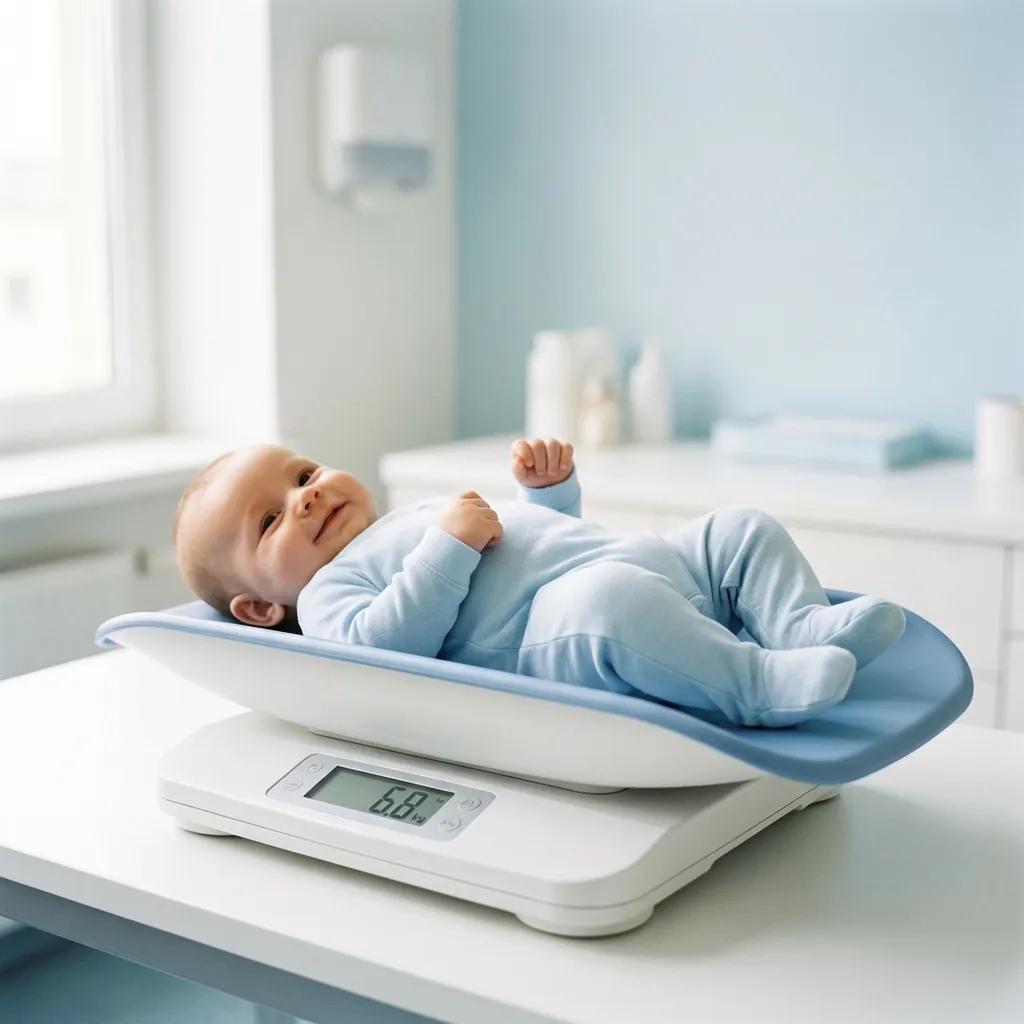
Free online tool
Weight percentile
What does the weight percentile tell you?
The weight percentile shows where your child sits in the weight distribution of healthy children of the same age and sex in the reference population. If your child is at the 75th percentile, it means they weigh more than 75% of those children and less than the remaining 25%. This ranking is derived from the WHO Child Growth Standards (2006), which were based on data from approximately 8,500 breastfed children across six countries (Brazil, Ghana, India, Norway, Oman, and the United States) raised under optimal health conditions.
Plot your child's growth percentile
Enter your child's sex, date of birth and measurements to see their exact weight-for-age, length-for-age and head-circumference percentiles on the official WHO charts — with an instant growth curve.
Open the WHO growth percentile calculator →A common misconception is that the 50th percentile is the 'ideal.' It is simply the midpoint. A child tracking steadily at the 20th percentile can be just as healthy as one tracking at the 80th. What matters far more than a single number is the consistency of the child's growth pattern over time.
Understanding the reference ranges
WHO weight-for-age categories
3rd - 97th percentile
Normal range
The vast majority of healthy children fall within this band. A child anywhere in this range is generally considered appropriately nourished, provided they are tracking consistently along their own curve.
Below 3rd percentile
Underweight
May indicate inadequate caloric intake, malabsorption (e.g., celiac disease, cow's milk protein allergy), chronic illness, or a genetic variant. Requires evaluation by a pediatrician.
Above 97th percentile
High weight for age
May indicate overfeeding, rapid weight gain, or in rare cases an endocrine condition. Should be assessed in context with the child's height and family build.
Below 0.1st percentile (−3 SD)
Severe underweight
Urgent medical assessment is recommended to rule out failure to thrive, neglect, or serious underlying conditions.
How to read the WHO growth chart
The WHO chart uses curved lines, each representing a specific percentile (3rd, 15th, 50th, 85th, 97th). The horizontal axis is age in months, the vertical axis is weight. To read the chart, find your baby's age on the bottom, go up to their weight, and see which curve they are closest to.
Follow the curve
A healthy baby's weight should roughly follow one of the curved lines over time. Minor fluctuations between two adjacent percentile lines are completely normal, especially during growth spurts or illness.
Watch for crossing
A shift crossing two or more major percentile lines — up or down — may indicate a nutritional or medical issue. Rapid upward crossing can signal overfeeding, while rapid downward crossing can indicate failure to thrive.
Use the right chart
The WHO charts (birth to 2 years) are recommended for all infants regardless of feeding type. After age 2, the CDC charts are commonly used in the United States, while the WHO charts continue to be the global standard.
Why the growth curve matters more than today's number
A single weight measurement is a snapshot. It can be influenced by a recent meal, hydration status, clothing, or the time of day. The real clinical value of weight percentiles comes from plotting multiple measurements over time to create a growth curve.
Pediatricians look for children who stay within the same growth channel, meaning their percentile remains roughly stable from visit to visit. A child who has always been at the 25th percentile and continues to track along that line is growing normally. In contrast, a child who drops from the 50th to the 10th percentile over six months is showing a worrisome trend, even though both numbers fall within the 'normal' range.
The UK's National Institute for Health and Care Excellence (NICE, guideline NG75) sets the threshold for concern about faltering growth according to birth weight: a fall across 1 or more centile spaces (the space between two adjacent lines on the UK-WHO chart) if birth weight was below the 9th centile, 2 or more if it was between the 9th and 91st, and 3 or more if it was above the 91st; a current weight below the 2nd centile is also a concern, whatever the birth weight. Conversely, rapid upward crossing of two channels may indicate excessive weight gain relative to height.
Normal weight gain patterns by age
Understanding typical weight gain rates helps parents calibrate expectations:
Expected weight gain
0-3 months
150-200 g/week
Rapid early growth. During these months breastfed and formula-fed babies gain weight at a similar pace; the difference appears after 3 months.
3-6 months
100-150 g/week
Growth velocity begins to slow. Doubling of birth weight typically occurs by 4-5 months.
6-12 months
70-100 g/week
Further deceleration. Tripling of birth weight is expected by 12 months.
1-2 years
40-60 g/week
Toddlers often become more selective eaters, and growth slows. Weight gain of about 2-3 kg total in the second year is normal.
2-5 years
~2 kg/year
Steady, slow gain. Children naturally lean out during this period as they become more active.
Breastfed vs formula-fed growth patterns
Breastfed and formula-fed babies grow differently, and understanding this distinction prevents unnecessary worry. In the first 3 months both groups gain weight at a similar pace, but between 4 and 12 months breastfed infants gain more slowly than formula-fed babies. This is normal physiology, not a problem.
The clearest evidence comes from the DARLING study (Dewey et al., Pediatrics, 1992), which measured breastfed and formula-fed infants every month from birth to 18 months: weight gain was similar during the first 3 months, but breastfed babies then gained more slowly, weighed about 0.65 kg less at 12 months and were leaner for their length, while length and head circumference were identical in both groups. A 2012 systematic review in the American Journal of Clinical Nutrition (Gale et al.) confirmed that feeding type also changes infant body composition: formula-fed infants had more fat-free mass during the first year. The WHO charts account for this because they are based primarily on breastfed children. Older CDC charts (pre-2010) were based on a mix of breastfed and formula-fed babies, which sometimes made breastfed infants appear to be 'falling behind' when they were growing perfectly normally.
Important for breastfeeding parents
If your pediatrician uses CDC charts and suggests your breastfed baby is underweight between 6 and 12 months, ask them to cross-reference the WHO chart. The WHO standard is the recommended reference for all infants under 2 years, regardless of feeding method (CDC recommendation, 2010).
Common reasons for percentile shifts
Benign causes
- Catch-up or catch-down growth in the first 18 months as the baby adjusts from birth size to genetic potential.
- Illness-related dips: A week of gastroenteritis can cause a temporary weight drop that resolves within a few weeks.
- Feeding transitions: Switching from breast milk to formula or from formula to solid foods may briefly alter the growth pattern.
- Growth spurts: Babies often gain weight in bursts rather than at a perfectly steady rate.
Causes that need investigation
- Persistent downward crossing of two or more percentile channels over several months.
- Weight loss after the newborn period (beyond the normal 5-10% loss in the first few days of life).
- Weight very disproportionate to height (e.g., weight at the 5th percentile but height at the 75th), which may indicate undernutrition.
- Excessive weight gain relative to height, which may signal overfeeding or an underlying endocrine issue.
- Feeding difficulties: recurrent vomiting, refusal to eat, or pain with feeding may point to reflux, food allergy, or mechanical issues.
How to weigh your child accurately
- Use the same scale each time, ideally a calibrated infant scale for babies under 2.
- Weigh infants naked, without a diaper, and older children in light underwear and without shoes.
- Measure at roughly the same time of day, preferably before a feed.
- Record the weight to the nearest 10 grams for infants and 100 grams for older children.
- Avoid comparing your child's weight to other children informally. Growth charts use standardized populations for a reason.
Using the weight percentile calculator
Our calculator uses the WHO Child Growth Standards to return your child's exact weight-for-age percentile, plus length and head-circumference percentiles if you enter them. Enter the child's sex, date of birth, the date of the measurement and the weight; for babies born preterm it corrects the age. The tool shows where your child falls on the growth curve and flags values below −2 SD (2.3rd percentile), below −3 SD (0.1st percentile) or above +2 SD (97.7th percentile).
For the best results, track at least three data points over several months. A single reading provides a snapshot, but three or more readings reveal a trend. Bring the results to your pediatrician to discuss in the context of feeding history, developmental milestones, and family growth patterns.
When to consult a pediatrician
See your doctor if:
There is objective weight loss after the newborn period; the growth curve flattens or drops for several consecutive months; weight is very disproportionate to height; the child shows signs of dehydration, lethargy, or persistent feeding refusal; or you have any gut feeling that something is off. Parents' intuition, combined with objective data, is a powerful diagnostic tool.
This article is for educational purposes only and does not replace professional medical advice. If you are concerned about your child's weight, consult a pediatrician or pediatric nutrition specialist for an individualized assessment.
Sources
- WHO - Child Growth Standards
- CDC — Grummer-Strawn LM et al. Use of WHO and CDC growth charts for children aged 0-59 months in the United States. MMWR Recomm Rep 2010
- Dewey KG et al. Growth of breast-fed and formula-fed infants from 0 to 18 months: the DARLING Study. Pediatrics 1992
- Gale C et al. Effect of breastfeeding compared with formula feeding on infant body composition: systematic review and meta-analysis. Am J Clin Nutr 2012
- NICE (2017). Faltering growth: recognition and management of faltering growth in children (NG75).